
Washington Parks and Recreation Statewide Survey
Executive Summary & Highlights

New study findings reveal that local park & recreation agencies provide an estimated 300,000 acres of park lands and support nearly 100 million users annually!
 During the Fall of 2020, the Washington Recreation & Parks Association, Washington State Association of Counties, Association of Washington Cities, and Metro Parks Tacoma collaborated on a statewide survey to gather data on service demand and operational challenges facing local parks agencies, both preceding and as a result of COVID-19 through August 2020. The survey was the most comprehensive one of its kind to compile data on issues and challenges facing local parks and recreation agencies throughout the State of Washington.
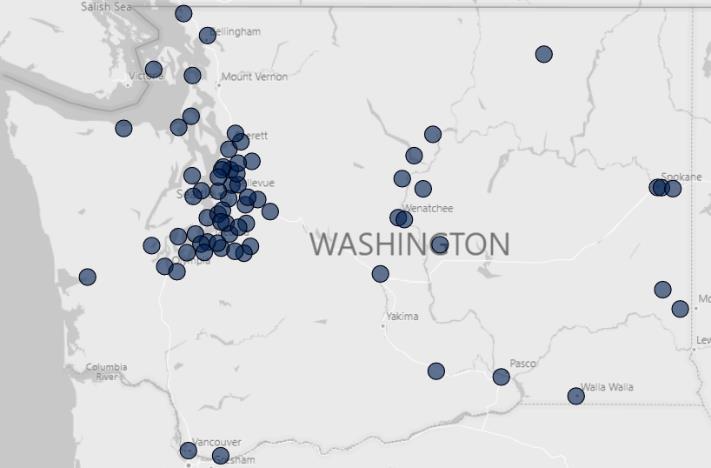
The goal of the survey is to show the degree of change between increasing demand and declining resources that all park and recreation agencies have experienced. The survey was sent to 109 cities, 39 counties, and 79 special purpose park districts (227 total), with a 33% response rate.
Review All Results
The 74 responding agencies manage over 120,500 acres of park land, with 37,599,970 users reported across all systems in 2019. Based on this sample, the statewide impact is estimated to be at over 300,000 acres of park lands, supporting nearly 100,000,000 users.
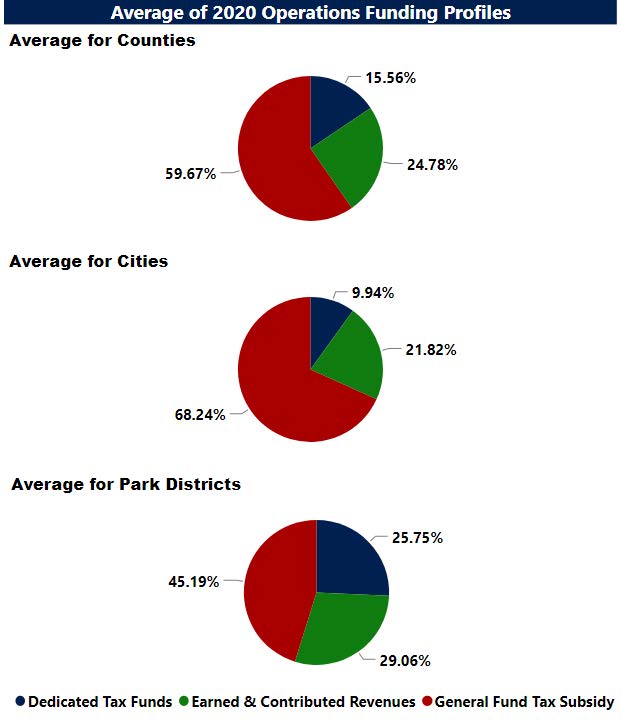 The operations funding profile of all agencies is a combination of the general fund, dedicated tax funds, and earned/contributed income. Responses ranged widely, from agencies relying on 100% earned revenue to in between. This mixture of funding results in varying degrees of operating stability, and destabilization when an economic crisis occurs.
Agencies with high levels of 100% dedicated tax funds to some combination of earned revenue and sales tax were particularly vulnerable and had immediate funding losses as a result of COVID-19.
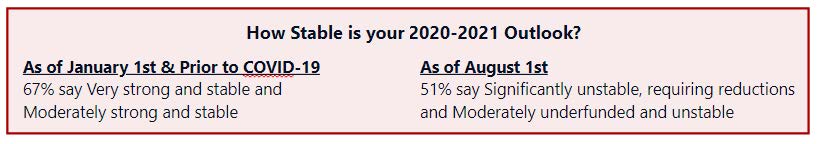
 Prior to COVID, 67% of parks agencies reported moderately or very strong and stable funding projections, with another 26% reporting level resources, or the ability to meet their annual operating requirements; 7% were underfunded or facing operating deficits.
As of August 1, that reversed with only 19% percent reporting moderately or very strong and stable funding, 30% level, and 51% reporting moderate or significant funding instability resulting in reductions in services due to funding gaps.
The average budget reduction was 23.2%, with an average loss of 60.9% in earned revenue in 2020.

Over the last 5 years, local park and recreation providers have absorbed steady increases in demands on park systems. High trail uses and use of specialized facilities such as dog parks, skate parks, and golf courses, as well as demand on pools and sports fields demonstrates the need growing populations have for outdoor recreation. In most cases, resources have grown only an average of 4.5% year over year to absorb this impact. This is the reason WRPA is seeking 1) more local funding options for maintenance and operations funding for park agencies, 2) an update to the statewide trails system, 3) high levels of investment in capital expansion and renovation grant programs through RCO.
In addition, COVID-19 has significantly drained operating resources while triggering a heavy increase in demand on the public spaces that offered Washington residents a safe, healthy respite during the pandemic. The mental and physical health benefits of being outdoors, walking, playing, and exploring are well established and can be found on NRPA's website.

While scheduled/reservable spaces were restricted, agencies saw a significant increase in passive, unscheduled use of parks and trails, 65% of agencies reported an increase of use, while some agencies reported up to 170% more usage, April-July 2020.
View the interactive results
View the Executive Summary
Why Parks And Recreation Agencies Should Be At The Forefront Of Recovery Efforts |
|
|
9 out of 10 |
Saw reduced ability to manage, maintain, operate and secure passive parks to safety standards and control access |
|
9 out of 10 |
Canceled special events and tourism campaigns that support local employment and drive the local economy |
|
8 out of 10 |
Had to address significant public use and behaviors that put the community at risk (such as tearing down caution tape, unauthorized use of fields) |
|
8 out of 10 |
Were unable to operate critical community programs, pools, attractions and facilities, including services for vulnerable populations |
|
Three-fourths |
Were unable to hire/maintain seasonal employees and couldn’t offer programs or services that were allowable under the Safe Start guidelines due to economic loss and staff reductions |
|
Half |
Experienced a distribution to planning and other professional requirements (outreach, grant submittals) due to loss of human and financial resources. |
|
Half |
Reallocated human and financial resources to COVID-19 response services, pausing ability to plan and deliver parks and recreation services. |
|
Half |
Experienced disruption to their capital program including renovation, safety improvements and new development of needed facilities. |
Blog Post Updated January 19, 2021